RECAP OF 1ST QUARTER 2024
NUMBER OF SALES
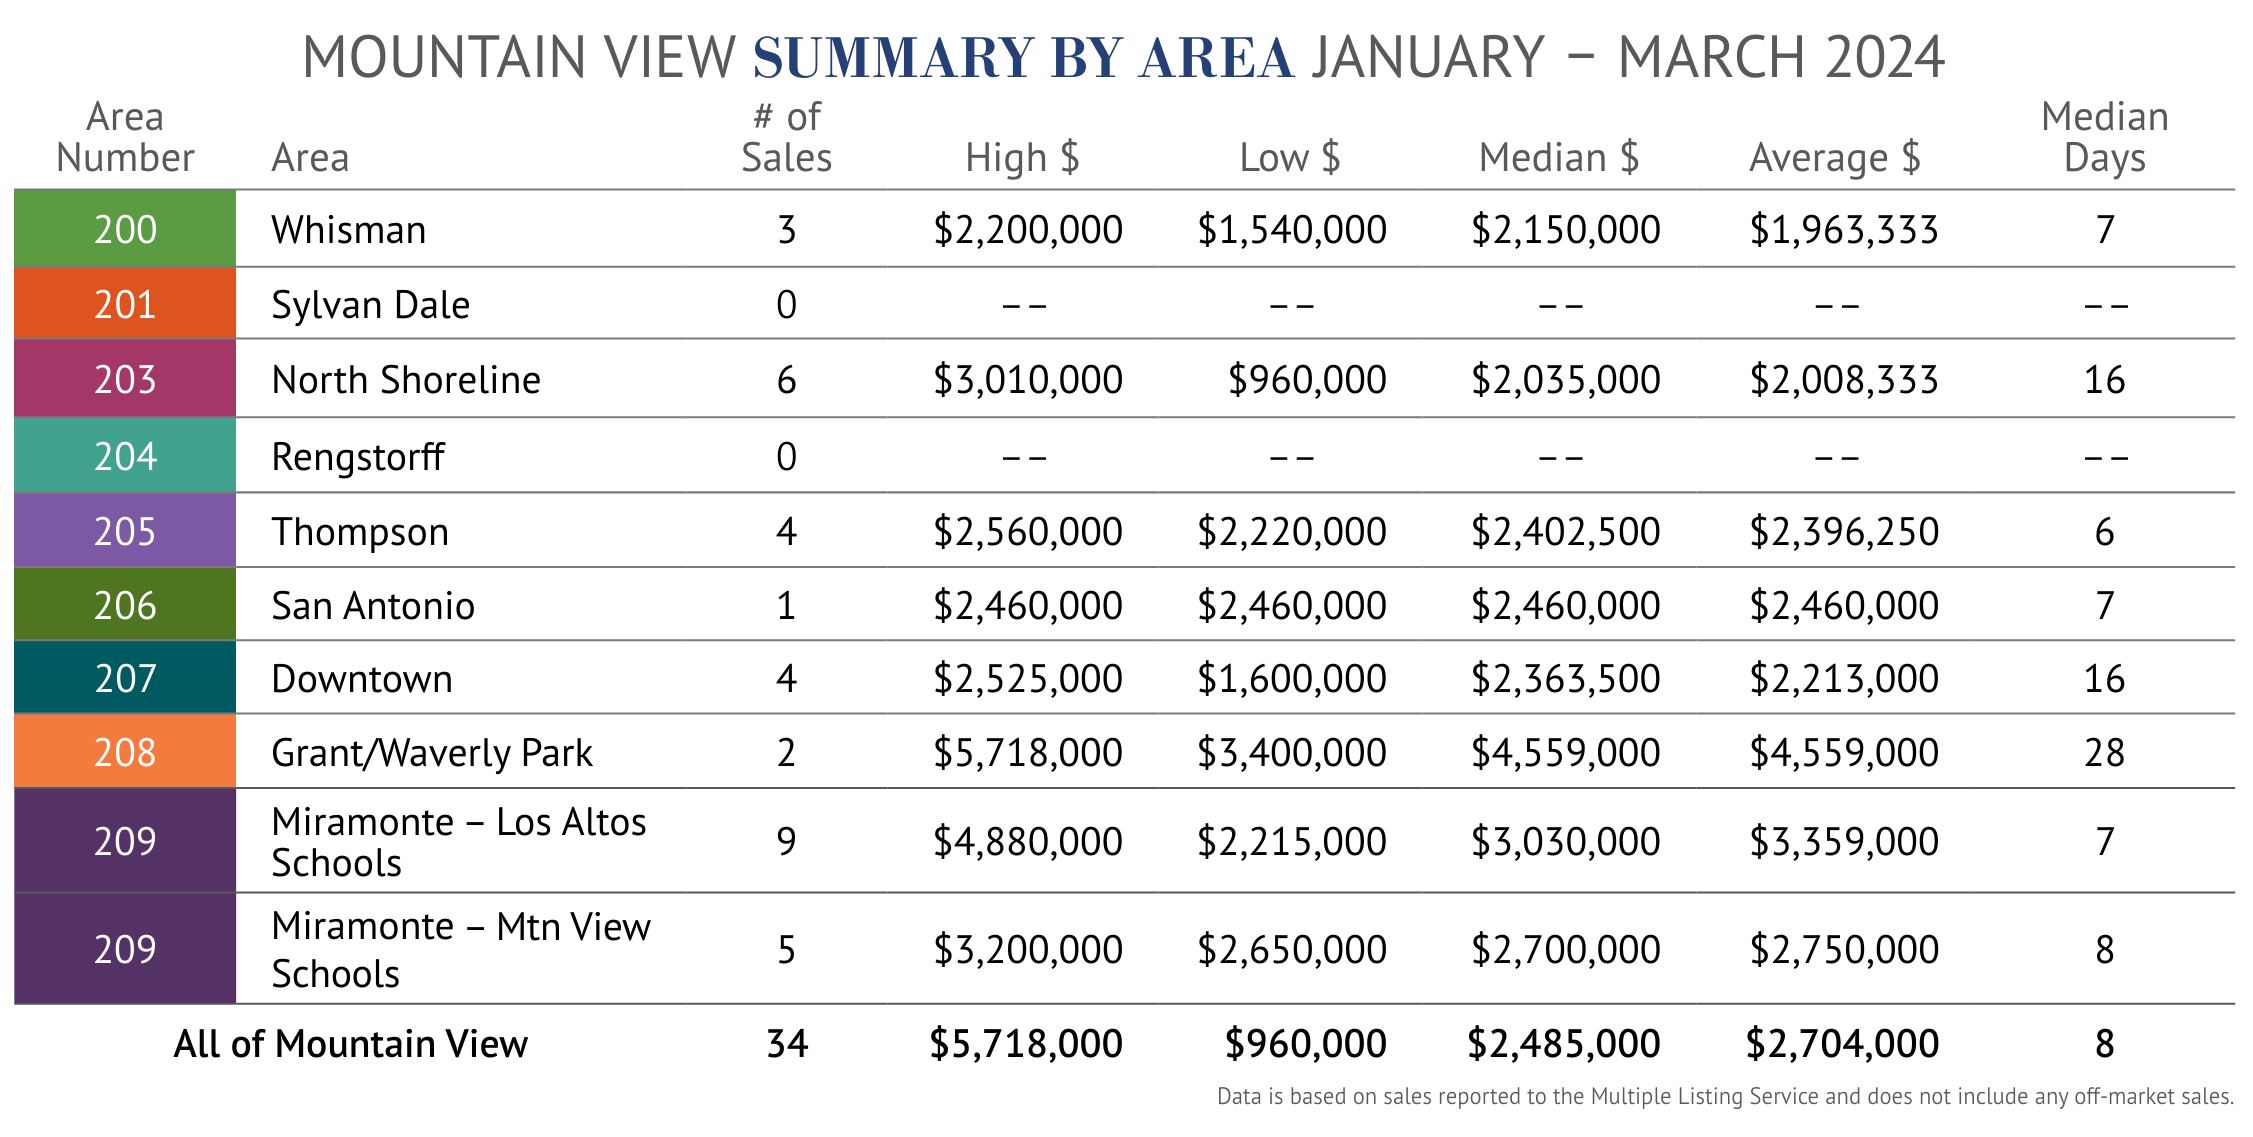
There were just 34 sales of single-family homes reported through the Multiple Listing Service in the 1st quarter. This compares to 54 sales in the 4th quarter and 67 in the 3rd quarter. The decline in sales is directly related to the few number of homes available for sale.
In addition to the 34 single-family home sales, there were a significant 47 condo/townhome sales. If you would like further details on condo/townhome sales this year, which are not included in this report, I would be happy to provide you my separate report on them or you can download a copy at davidtroyer.com/MVreport.
PRICES
Prices were strong in the 1st quarter with a 1% increase in the average price and a record-high in the price per square foot. At an average of $1,691 per square foot, this represents a 7% increase compared to last year. The median price did fall 2.5% compared to last year.
Strong demand was evidenced by the fact that an amazing 76% of the homes sold for more than list price. This compares to 69% in 2023.
LENGTH OF TIME TO SELL
Continuing the trend from last year, homes sold very fast in the 1st quarter with 71% selling in less than 2 weeks and 47% selling in one week or less. There were just 7 homes on the market for more than 30 days.
OUTLOOK
In my 2023 annual report to you at the beginning of this year, I anticipated a slower start in the first several months of this year with notably low inventory levels, resulting in strong prices and thus creating a seller’s market. This has been the case. I also anticipated then, and still do, a slower-than-usual Q3 because of the politically charged election in November.
I am encouraging sellers to act now and not delay as there are many buyers in the market right now but very few homes available for sale in Mountain View. Currently, there are just 23 homes for sale, plus another 3 homes that are being privately marketed. The weather this year has been a factor as well with the inventory levels, with unusually wet and cold days. Now that perhaps we have turned that corner, I expect competition to heat up.
I remain optimistic on the long-term value of owning a home in Mountain View, which continues to be one of the best places to live in Silicon Valley – particularly with its vibrant downtown and excellent schools. Now is an opportune time to consider listing your property with The Troyer Group. Our team has a proven track record of helping sellers prepare their homes for sale quickly and effectively, and we’re committed to getting you the best possible price for your property. Please don’t hesitate to contact us to discuss your individual situation today.
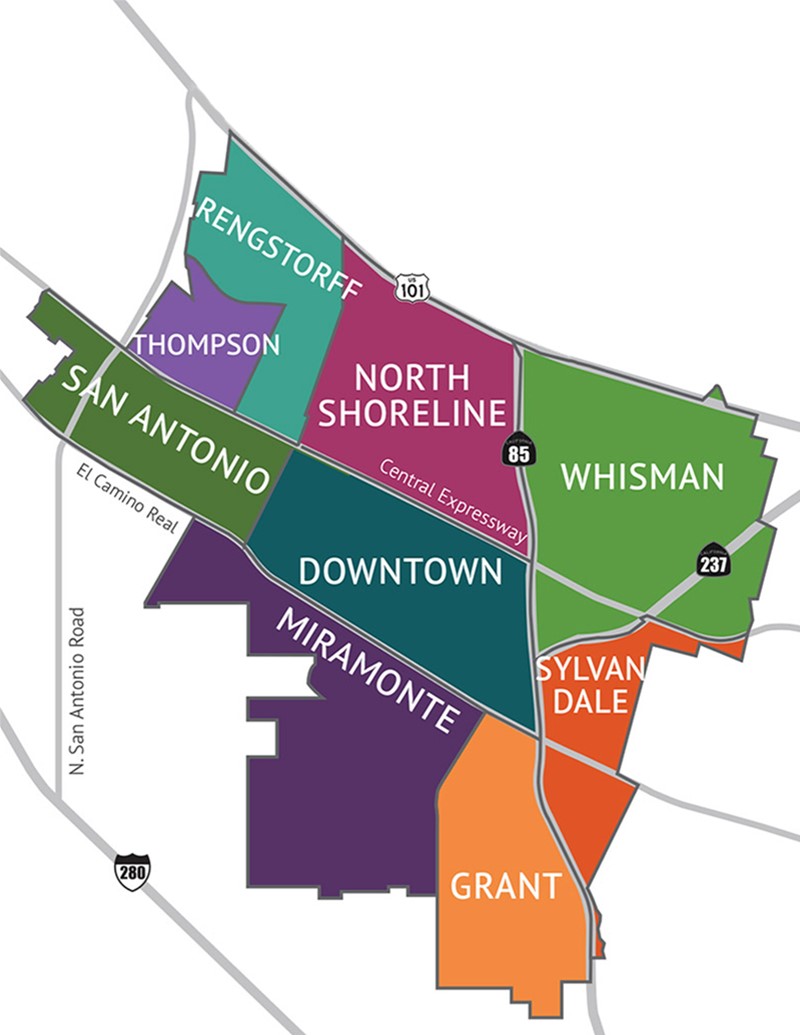
Rollover or click map to see more information for each area.

Rollover or click map to see more information for each area.
There were just 3 sales in the 1st quarter, all of which sold for more than list price. Prices were strong with the average down slightly from last year and the median price remaining far over $2 million at $2,150,000. Homes sold very fast with a median days of just 7.
Number of sales in this area generally ranges from 0 to 5, so it is not unusual that there were no sales in this area in the 1st quarter. As of the end of 2023, the average price here was $2,418,111.
There were few sales in the 1st quarter with just 6, 4 of which sold for more than list price. Prices varied with the average price down 9% however, the median price was up to $2,035,000. Homes took longer to sell at a median days on market of 16 due to 2 homes taking longer than 40 days to sell.
There were no sales in the 1st quarter in this area. The average price here at the end of last year was $1,605,172.
There were 4 sales in this area in the 1st quarter, 3 of which sold for significantly more than list price. Thus, record high prices were reached. The average price increased 15% to $2,396,250 and the median price increased to more than $2.4 million for the fist time. 3 of the 4 homes sold in one week or less.
There was just 1 sale in this area in the 1st quarter, which sold for 12% more than list price in one week. At $2,460,000, this sale was 8% lower than the average price last year, which was $2,667,500.
There were just 4 sales in this popular area in the 1st quarter, 2 of which sold over list price. The average price was down 8% compared to last year but the median price exceeded $2.3 million. The 2 homes that sold over list price each sold in 8 days; the others took substantially longer.
This popular area usually has the most sales, however there were only 2 sales in the 1st quarter due to the low number available for sale. The highest priced sale in Mountain View this year occurred here at $5.7 million that sold for quite a bit under list price. The other home sold in just 9 days for 14% more than list price.
This very popular area had 9 sales, more than in any other area in Mountain View. All but one home, surprisingly the least expensive, sold for more than list price and on average for 10% over list. As a result, prices reached record highs with the average price up 7% to $3,359,000.
There were 5 sales in the 1st quarter and every one of them sold for more than list price. On average homes sold for 5% over list. However, the average price declined 2% to $2,750,000. All but one of the homes sold in less than 2 weeks.
RECAP OF 1ST QUARTER 2024
NUMBER OF SALES
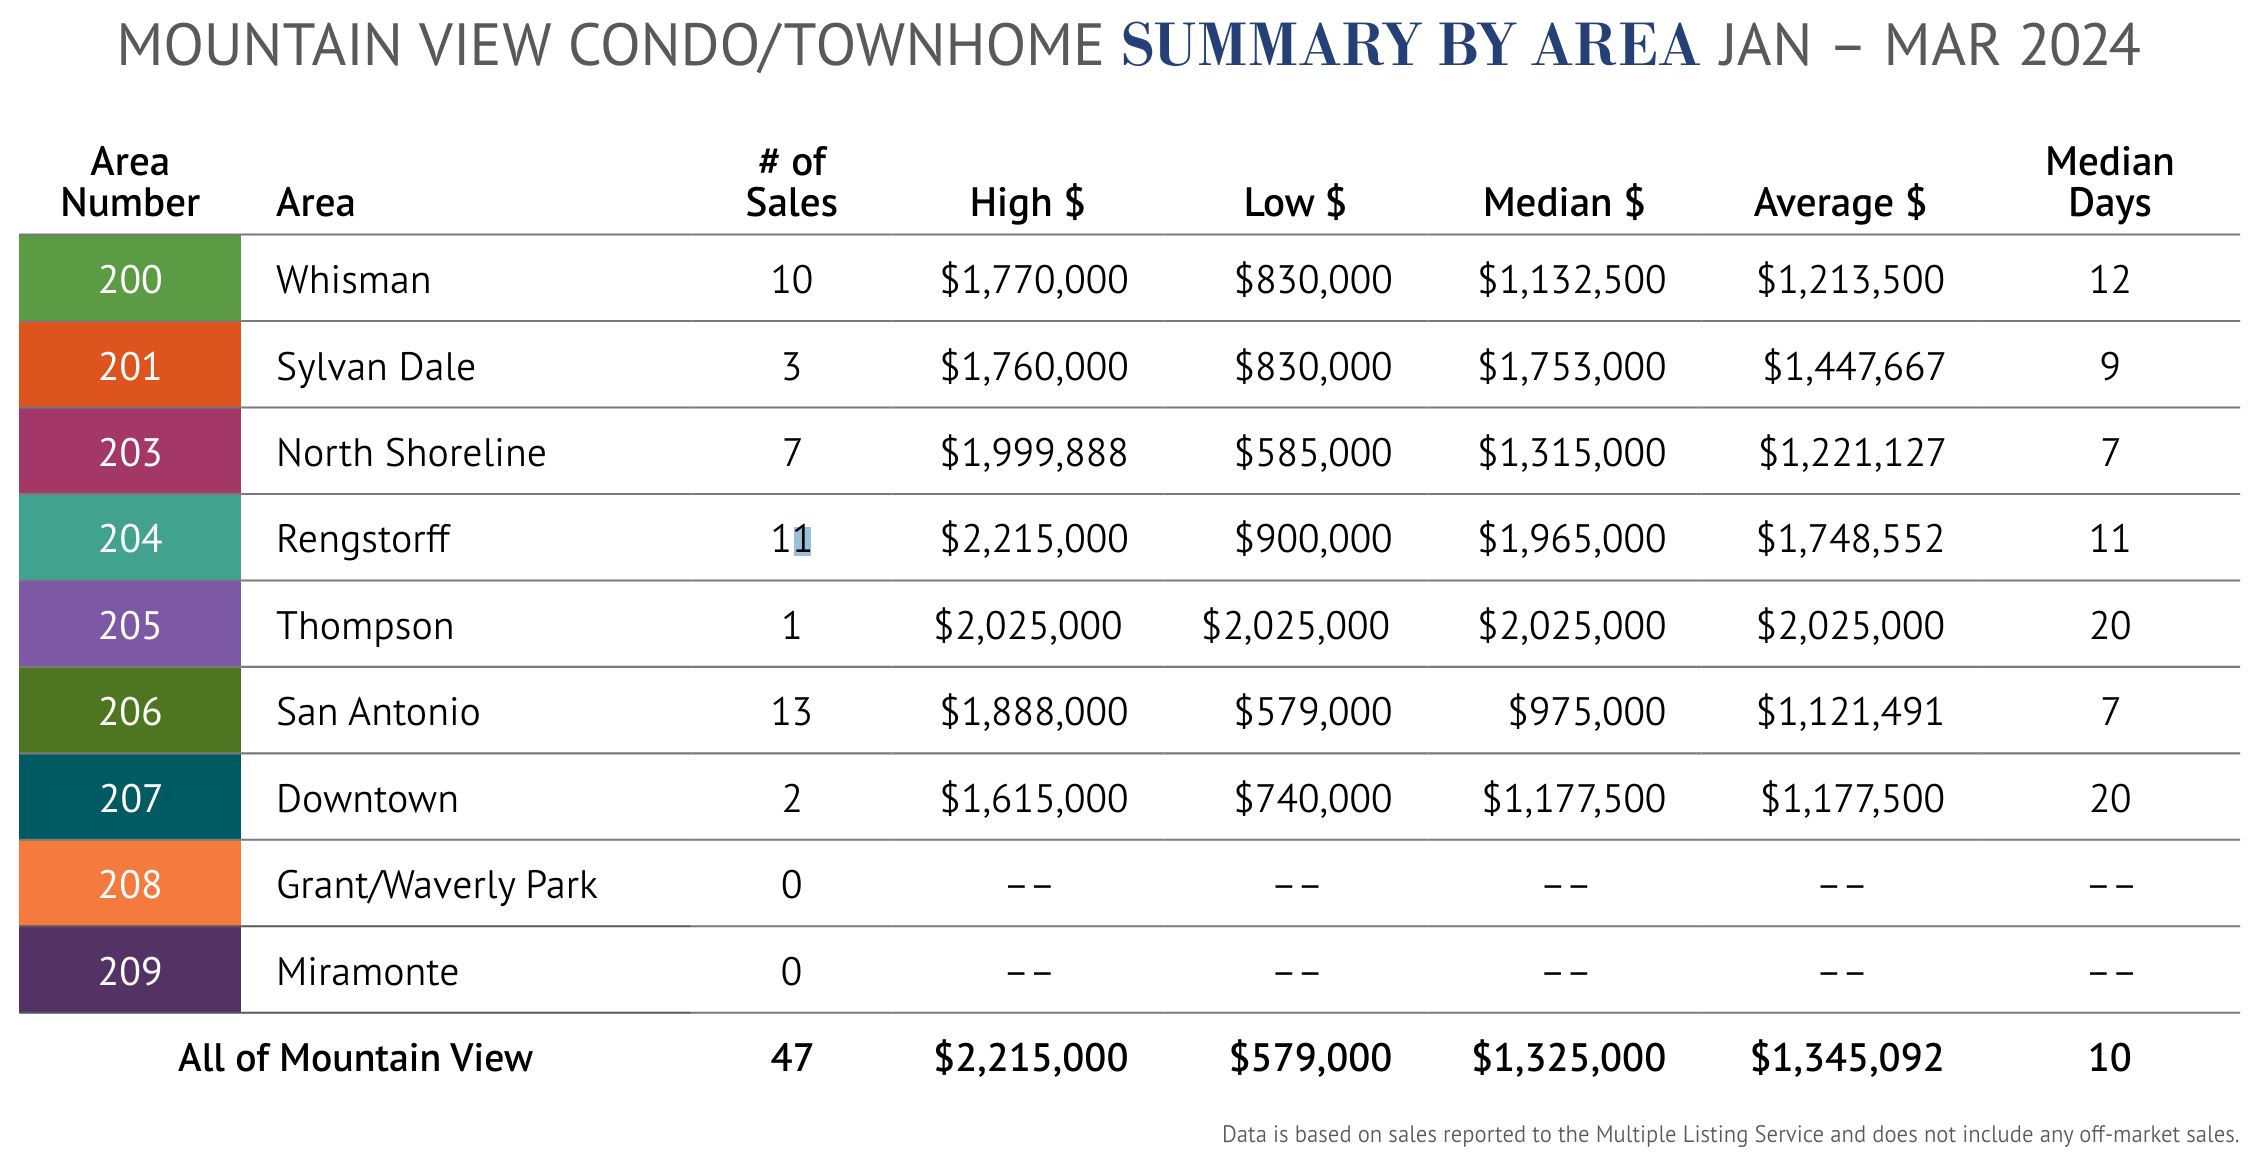
There were just 47 sales of condos/townhomes reported through the Multiple Listing Service in the 1st quarter. This compares to 54 sales in the 4th quarter and 67 in the 3rd quarter. The low number of sales is due to the few number available homes for sale.
In addition to the 47 condo/townhome sales, there were 34 single-family home sales. If you would like further details on the single-family homes sales this year in Mountain View, which are not included in this report, I would be happy to provide you my separate report on them or you can download a copy at davidtroyer.com/MVreport.
PRICES
Despite the significant decline in number of sales, prices held steady or increased in the 1st quarter. The average price increased by 1% to a record high of $1,345,092. The median price remained unchanged at $1,325,000.
A significant 68% of the homes sold for more than list price. 6 homes sold for more than $2 million and 15 homes sold for less than $1 million.
The price per square foot in the 1st quarter reached $988 – a 3% increase since last year. The previous high was the same price per square foot in 2022.
LENGTH OF TIME TO SELL
Homes sold faster than last year. Half of the homes sold in 10 days or less, compared to 11 days last year, and the average days on market was 25 due to 3 homes on the market for more than 140 days.
Rollover or click map to see more information for each area.
Rollover or click map to see more information for each area.
This area had one of the highest numbers of sales in the
1st quarter. There were 10 sales, 7 of which were for more
than list price. Only 3 homes sold for less than $1 million.
Both the average price and median price were down 8% and
19%, respectively
There were 3 sales in this area, the 2 highest of which were
for more than list price. The average price reached a record
high increasing 11% to $1,447,667. The median price also
reached a record high increasing 18% to $1,753,000.
There were 7 sales in this area, and all but one, the least
expensive home, sold for list price or more. Only 2 sold for
less than $1 million and as a result the average price was up
7% to a new record high of $1,221,127. The median price was
also up 7% to a record high of $1,315,000. Only 1 home took
longer than 30 days to sell.
This in-demand area had the second-highest number of sales
in any area of Mountain View in the 1st quarter. There were
11 sales, and 7 were for more than list price. The average
price was up a significant 21% to a new record high of
$1,748,552. The median price increased even more at 31% to
a record high of $1,965,000. Only one home sold for less
than $1.3 million.
This area has just a few complexes so it was not unusual to
have just 1 sale in the 1st quarter. This home sold just under
list price for $2,025,000 which is 15% higher than last year’s
average of $1,756,556.
This area had more sales than any other area in Mountain View.
There were 13 sales in the 1st quarter, 10 of which were for
more than list price, including the most expensive sale. 7 sales
were for less than $1 million although both the average and
median prices increased by 12% and 20%, respectively.
There were just 2 sales in this popular area in the 1st quarter;
there were only 7 sales in 2023. The highest priced sale sold
for more than list price at $1,615,000 and the other sale was
for less than list price at $740,000 but it sold in just 6 days.
There were no condo/townhome sales in this area in the
1st quarter and only 1 in all of 2023. The average price in
this area last year was $1,800,000.
209 MIRAMONTE
There were no condo/townhome sales in this area in the
1st quarter; there were 12 in all of 2023. The average price
in this area last year was $1,363,417.