RECAP OF 3rd Quarter 2025
NUMBER OF SALES
There were 39 sales in the 1st quarter, 83 sales in the 2nd quarter, and 59 sales in the 3rd quarter. This total of 181 sales through the 3rd quarter compares to 208 sales in the same period last year – a 13% decline.
In addition to the 59 single-family home sales in the 3rd quarter, there were 83 condo/townhome sales. If you would like further details on condo/townhome sales this year, which are not included in this report, I would be happy to provide you with my separate report on them or you can download a copy at davidtroyer.com/MVreport.
PRICES
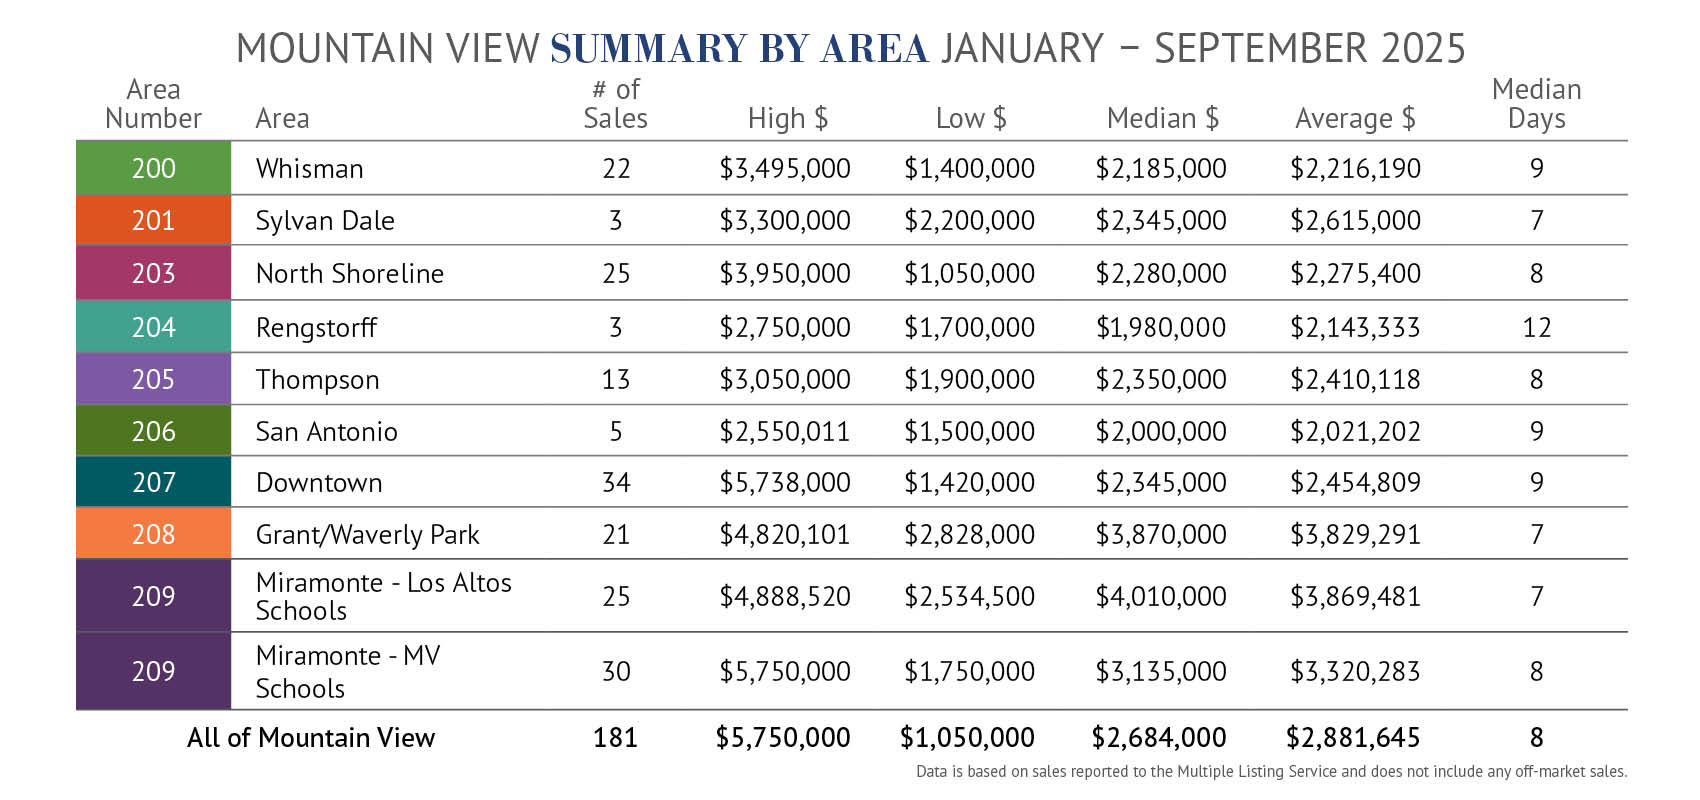
The average price for the 59 homes sold in the 3rd quarter was $2,894,955. 2 homes sold for more than $5.4 million and no homes sold for less than $1.5 million. The average price in the 3rd quarter was up 6% compared to the same quarter last year. Year-to-date through the 3rd quarter, the average price of $2,881,645 was up 3% compared to all of last year.
The median price in the 3rd quarter was $2,547,600, representing a 2% decline compared to the same quarter last year. Year-to-date through the 3rd quarter, the median price of $2,684,000, was up 1% compared to all of last year.
There were 34 homes, or 58%, that sold for more than list price in the 3rd quarter. On average, homes in the 3rd quarter sold for 105% of list.
The price per square foot through the 3rd quarter was $1,667 – a slight decline compared to all of 2024 when it was $1,672.
LENGTH OF TIME TO SELL
Homes sold quickly in the 3rd quarter with half selling in just 8 days or less and 73% selling in 2 weeks or less. On average, homes in the 3rd quarter sold in 17 days.
OUTLOOK
As I reported to you in my 1st Half Report (find it at DavidTroyer.com/mvreport), the market growth this year has exceeded my expectations and continued to do so in the 3rd quarter. While some uncertainty remains, the stock market has reached new highs – a positive indicator for the real estate market, especially in our area. Based on the incredibly strong demand we have seen so far this year, I now expect a continued accelerated pace given the strong demand and limited inventory. My optimism prevails for Mountain View, especially for sellers.
Mountain View continues to be one of the most desirable places to live in the Bay Area. The presence of excellent schools, a vibrant downtown area, and its convenient location in the heart of Silicon Valley make it a smart investment for buyers, which is why property prices remain high.
With just 17 homes actively for sale (and another 5 homes being privately marketed), now is an opportune time to list your home for sale with The Troyer Group. Our team has a proven track record of helping sellers prepare their homes for sale quickly and effectively, and we are committed to getting you your price or more. Please do not hesitate to contact us; you have nothing to lose.
PRICES
The average price for the 59 homes sold in the 3rd quarter was $2,894,955. 2 homes sold for more than $5.4 million and no homes sold for less than $1.5 million. The average price in the 3rd quarter was up 6% compared to the same quarter last year. Year-to-date through the 3rd quarter, the average price of $2,881,645 was up 3% compared to all of last year.
The median price in the 3rd quarter was $2,547,600, representing a 2% decline compared to the same quarter last year. Year-to-date through the 3rd quarter, the median price of $2,684,000, was up 1% compared to all of last year.
There were 34 homes, or 58%, that sold for more than list price in the 3rd quarter. On average, homes in the 3rd quarter sold for 105% of list.
The price per square foot through the 3rd quarter was $1,667 – a slight decline compared to all of 2024 when it was $1,672.
LENGTH OF TIME TO SELL
Homes sold quickly in the 3rd quarter with half selling in just 8 days or less and 73% selling in 2 weeks or less. On average, homes in the 3rd quarter sold in 17 days.
OUTLOOK
As I reported to you in my 1st Half Report (find it at DavidTroyer.com/mvreport), the market growth this year has exceeded my expectations and continued to do so in the 3rd quarter. While some uncertainty remains, the stock market has reached new highs – a positive indicator for the real estate market, especially in our area. Based on the incredibly strong demand we have seen so far this year, I now expect a continued accelerated pace given the strong demand and limited inventory. My optimism prevails for Mountain View, especially for sellers.
Mountain View continues to be one of the most desirable places to live in the Bay Area. The presence of excellent schools, a vibrant downtown area, and its convenient location in the heart of Silicon Valley make it a smart investment for buyers, which is why property prices remain high.
With just 17 homes actively for sale (and another 5 homes being privately marketed), now is an opportune time to list your home for sale with The Troyer Group. Our team has a proven track record of helping sellers prepare their homes for sale quickly and effectively, and we are committed to getting you your price or more. Please do not hesitate to contact us; you have nothing to lose.
Rollover or click map to see more information for each area.

Rollover or click map to see more information for each area.
There were 6 sales in the 3rd quarter and 22 total sales this year. The average price in the 3rd quarter was $2,158,548. Year-to-date through the 3rd quarter, the average of the 22 sales was $2,216,190, which was 4% higher than all of last year when the average price was $2,124,661.
There were no sales in the 3rd quarter in this area. There have been just 3 sales all year. The average price through the 3rd quarter was $2,615,000, which was less than 1% lower than it was in 2024.
There were 11 sales in the 3rd quarter in this popular area, 6 of which sold for more than list price. On average, homes sold for 102% of list price. The average price was $2,508,465, which was 8% higher than it was last year. Homes sold very quickly with only one home taking longer than 13 days to sell.
There were just 2 sales in the 3rd quarter and a total of 3 sales this year. The average price in the 3rd quarter was $1,840,000. Year-to-date through the 3rd quarter, the average of the 3 sales was $2,143,333, which was 2% lower than all of last year when there were 8 sales.
There were just 2 sales in this area in the 3rd quarter, and there have been 13 sales this year. The average price was $2,068,665 and year-to-date through the 3rd quarter, the average price was $2,410,118, which was 7% higher than all of last year.
There was only 1 sale in San Antonio in the 3rd quarter and there have been 5 sales this year. The sale in the 3rd quarter was $1,500,000. Year-to-date through the 3rd quarter, the average of the 5 sales was $2,021,202, which was 11% lower than all of last year when there were 11 sales.
This area had the greatest number of sales in the 3rd quarter. There were 13 sales and 7 were for more than list price. The average price was $2,538,692. Year-to-date through the 3rd quarter, the average price was $2,454,809, which was 2% lower than last year.
There were only 5 sales in this popular area and all but 2 sold for substantially more than list price. The average price in the 3rd quarter was $3,631,000. The average price year-to-date through the 3rd quarter for 21 sales was $3,829,291, a 3% decline from last year.
This very popular area had 8 sales in the 3rd quarter and all but 1 sold for more than list price. Only 1 took longer than 2 weeks to sell. The average 3rd quarter price was $4,177,000. The year-to-date average price through the 3rd quarter was $3,869,481, which was 3% higher than last year.
There were 11 homes sold in the 3rd quarter, 5 of which sold for more than list price and in 9 days or less. The average price in the 3rd quarter was $3,306,055. Year-to-date for the 30 sales, the average was $3,320,283, which was 8% higher than last year.
RECAP OF 1ST HALF 2025
NUMBER OF SALES
There were 83 sales of condos/townhomes reported through the Multiple Listing Service in the 3rd quarter compared to 85 sales in the 2nd quarter and only 43 sales in the 1st quarter.
In addition to the 83 condo/townhome sales, there were 59 single-family home sales. If you would like further details on the single-family homes sales this year in Mountain View, which are not included in this report, I would be happy to provide you with my separate report on them or you can download a copy at davidtroyer.com/MVreport.
PRICES
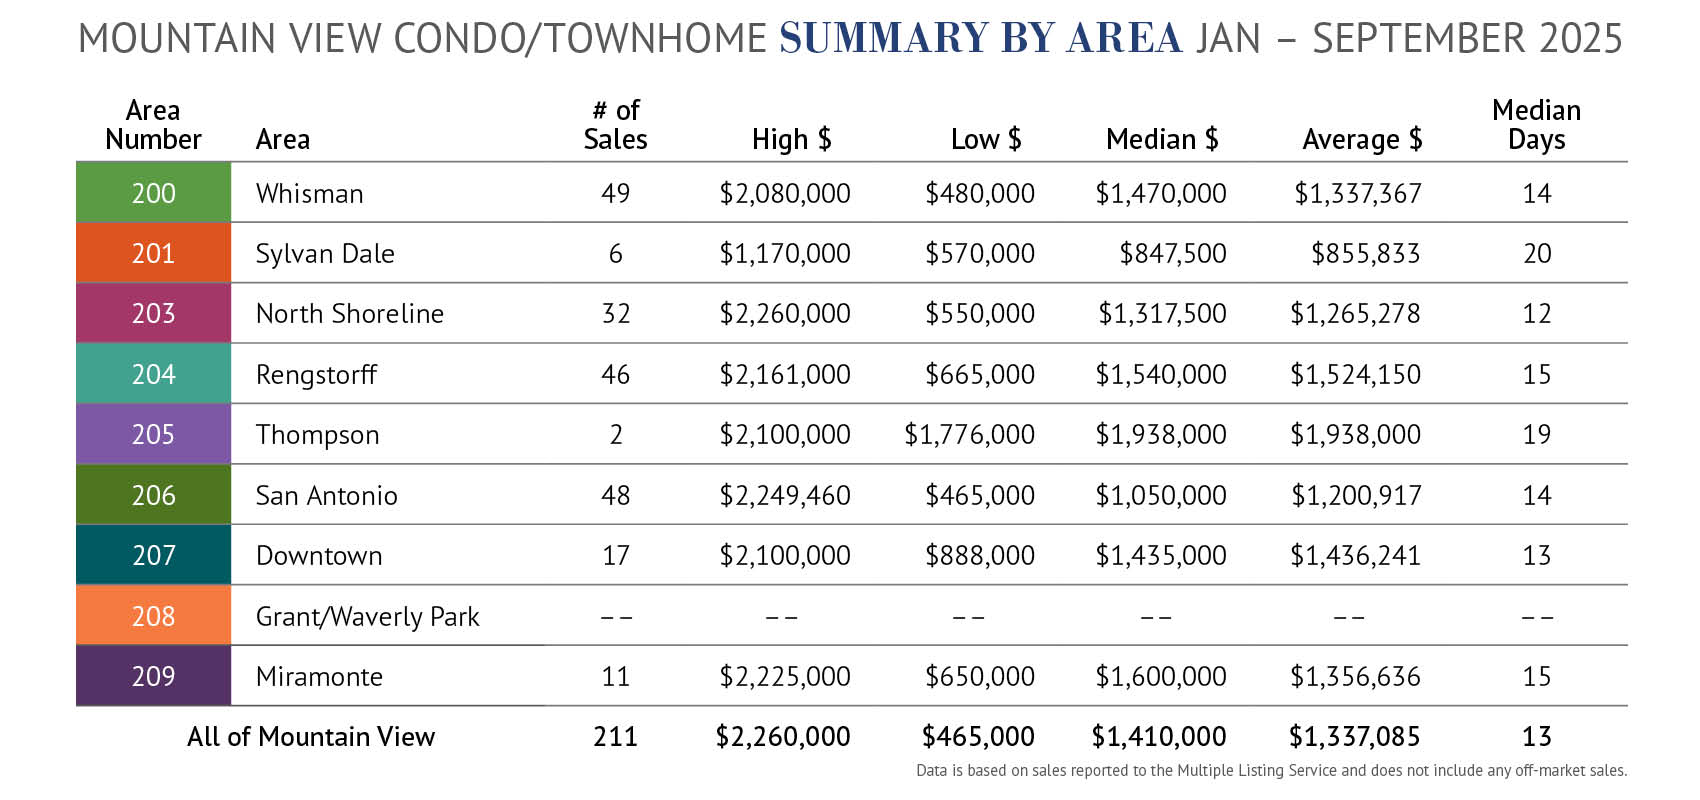
With the robust number of sales this year, prices through the 3rd quarter reached record highs. Following 5 years of fairly stagnant prices, the average price year-to-date reached $1,337,085, an increase of 4%. The median price was even higher at $1,410,000 and a significant 8% increase compared to last year.
Average price by quarter saw a downward trend as the year progressed with $1,376,602 in the 1st quarter, $1,365,524 in the 2nd quarter, and $1,287,488 in the 3rd quarter.
There were 28 homes that sold for less than $1 million and 31 homes that sold for $1.5 million or more. 6 homes sold for $2 million or more (compared to 5 in the 3rd quarter last year).
The average price per square foot in the 3rd quarter was $968, down slightly from all of last year when it was $974.
60% of the homes sold for more than list price compared to just 49% in the same quarter last year.
LENGTH OF TIME TO SELL
Condos/townhomes sold quickly in the 3rd quarter with 47% selling in less than 2 weeks; 35% took longer than 30 days to sell. The median days on market for condos/townhomes in the 3rd quarter was 18 days.
OUTLOOK
As I reported to you in my 1st Half Report (find it at DavidTroyer.com/mvreport), the market growth this year has exceeded my expectations and continued to do so in the 3rd quarter. While some uncertainty remains, the stock market has reached new highs – a positive indicator for the real estate market, especially in our area. Based on the incredibly strong demand we have seen so far this year, I now expect a continued accelerated pace given the strong demand and relatively low inventory. My optimism prevails for Mountain View, especially for sellers.
Mountain View continues to be one of the most desirable places to live in the Bay Area. The presence of excellent schools, a vibrant downtown area, and its convenient location in the heart of Silicon Valley make it a smart investment for buyers, which is why property prices remain high.
Inventory has increased with 45 condos/townhomes actively for sale, yet buyer demand prevails. This is an opportune time to list your home for sale with The Troyer Group. Our team has a proven track record of helping sellers prepare their homes for sale quickly and effectively, and we are committed to getting you your price or more. Please do not hesitate to contact us; you have nothing to lose.
Rollover or click map to see more information for each area.
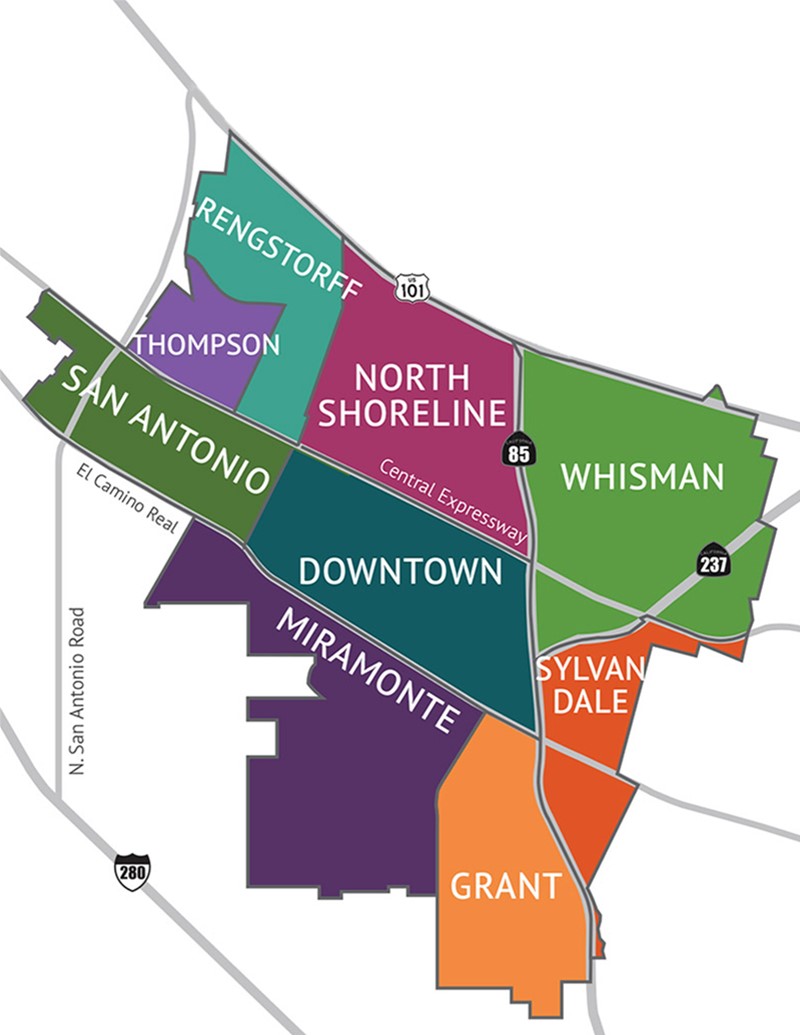
Rollover or click map to see more information for each area.
Sales were strong here with 18 homes sold, 9 of which sold over list price. There have been 49 sales this year, the most in any area of Mountain View. 24 of these sales were for $1.5 million or more. The average price in the 3rd quarter was $1,171,778. Year-to-date through the 3rd quarter the average was $1,337,367, which was 1% lower than last year.
There were no sales in the 3rd quarter and there have only been 6 this year, 4 of which were for less than $900,000. Consequently, the average price year-to-date through the 3rd quarter was $855,833, which was 27% lower than all of last year.
This popular area had 17 sales in the 3rd quarter and 10 of those were for more than list price. The average price was $1,256,076. Year-to-date through the 3rd quarter there have been 32 sales with an average price of $1,265,278. This was 11% higher than last year’s average price.
This area had 18 sales in the 3rd quarter, and 11 of those sold over list price. There were 3 sales for more than $2 million and 2 sales for less than $1 million. The average price in the 3rd quarter was $1,506,679. Year-to-date, the average price for the 46 sales of $1,524,150 was 4% lower than last year.
This area has just a few townhome complexes, and there were no sales in the 3rd quarter. There have been 2 sales this year with an average price of $1,938,000. This is 1% higher than it was in all of 2024.
This area had strong sales with 16 in the 3rd quarter and 10 of those were for more than list price. One sale was for $2 million and 9 were for less than $1 million. The average price in the 3rd quarter was $1,088,187; year-to-date the average was $1,200,917, putting it a significant 15% higher than last year.
There were 8 sales in the 3rd quarter, 4 that sold over list price. Year-to-date through the 3rd quarter there have been 17 sales, 11 of which have sold over list price. The average 3rd quarter price was $1,533,250. The year-to-date average was $1,436,241, which was 8% higher than all of last year.
There have been no condo/townhome sales in this area since 2023. There was just 1 sale in each of 2020, 2021, and 2022; in 2023 there were 3 sales. Average prices have ranged from $1.6 million to
$1.9 million.
209 MIRAMONTE
There were 6 sales in the 3rd quarter, all but one of which (the lowest price) sold for more than list price. The average price in the 3rd quarter was $1,269,833. There have been 11 sales year-to-date and the average price was $1,356,636. This was 6% higher than it was last year when there were 9 sales.