RECAP OF 3RD QUARTER 2025
• Average Q3 price of $4,847,514; down 2% compared to Q3 last year
• 54% sold over list price in Q3
• 74% sold in 2 weeks or less in Q3
• 7 sales for more than $7 million in Q3 compared to 8 in Q3 last year
• YTD average price up 9% compared to all of last year
NUMBER OF SALES
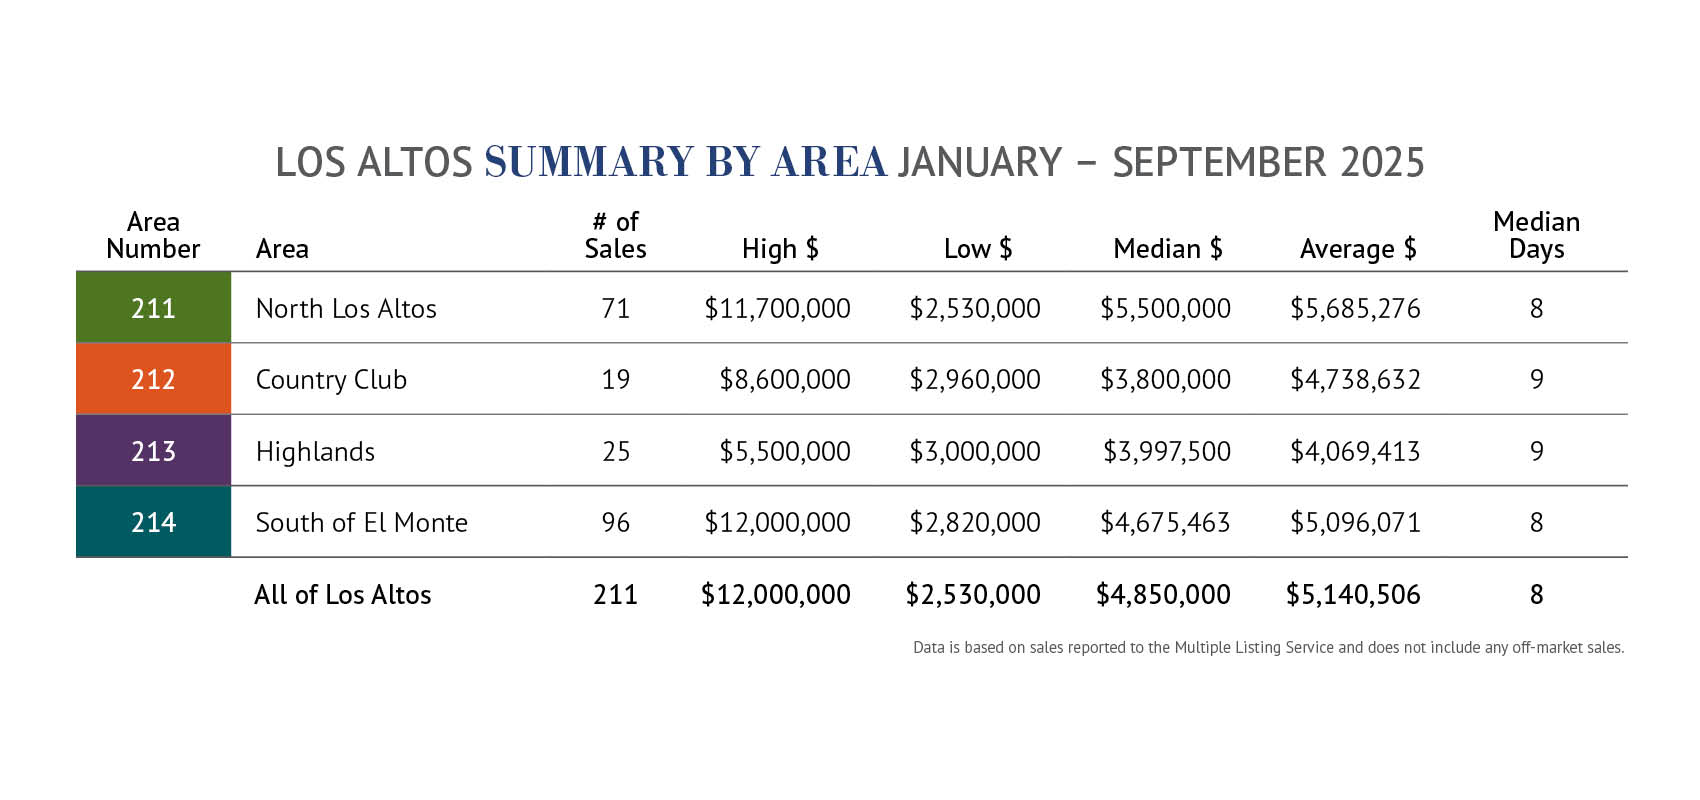
There were 43 sales in the 1st quarter, 98 sales in the 2nd quarter, and 70 sales in the 3rd quarter. This total of 211 sales through the 3rd quarter compares to 199 sales in the same period last year – a 6% increase.
In addition to the 70 single-family home sales in the 3rd quarter, there were 14 condo/townhome sales. If you would like further details on condo/townhome sales this year, which are not included in this report, I would be happy to provide them to you.
PRICES
The average price for the 70 homes sold in the 3rd quarter was $4,847,514. 7 homes sold for more than $7 million and 23 homes sold for more than $5 million. The Troyer Group is honored to have represented the buyer of the most expensive home sold at $10.4 million. Only 3 homes sold for less than $3.3 million.
The average price in the 3rd quarter was down 2% compared to the same quarter last year and down a significant 18% from the 1st quarter high this year, when it was almost $6 million. Year-to-date through the 3rd quarter, the average price of $5,140,506 was up 9% compared to all of last year.
The median price in the 3rd quarter was $4,312,500, representing a 6% decline compared to the same quarter last year. Year-to-date through the 3rd quarter, the median price of $4,850,000 was up 10% compared to all of last year.
The price per square foot through the 3rd quarter was $2,006 – a 5% increase compared to all of 2024 and the first time exceeding $2,000 per square foot.
There were 38 homes, or 54%, that sold for more than list price in the 3rd quarter. On average, homes in the 3rd quarter sold for 105% of list price.
LENGTH OF TIME TO SELL
Homes sold very quickly in the 3rd quarter with half selling in just 8 days or less and 74% selling in 2 weeks or less. On average, homes in the 3rd quarter sold in 14 days.
OUTLOOK
As noted in my 1st Half Report (find it at DavidTroyer.com/lareport), Los Altos home values reached record highs in the first half. Since then, average prices have moderated slightly each quarter, following a remarkable multi-year climb that began in 2019. This recent adjustment reflects a normalization after exceptional growth, not a downturn. Even with this easing, prices remain among the highest ever recorded for Los Altos and we are seeing homes selling for more than $1 million over list price and with up to 20 offers.
Steady demand, limited inventory, and strong buyer confidence continue to define the local market. While the pace of appreciation has slowed, Los Altos real estate remains a premier investment supported by enduring desirability, excellent schools, and Silicon Valley’s ongoing strength.
With just 17 homes for sale, now is an opportune time to list your home for sale with The Troyer Group. Our team has a proven track record of helping sellers prepare their homes for sale quickly and effectively, and we are committed to getting you your price or more. Please do not hesitate to contact us; you have nothing to lose.
Rollover or click map to see more information for each area.
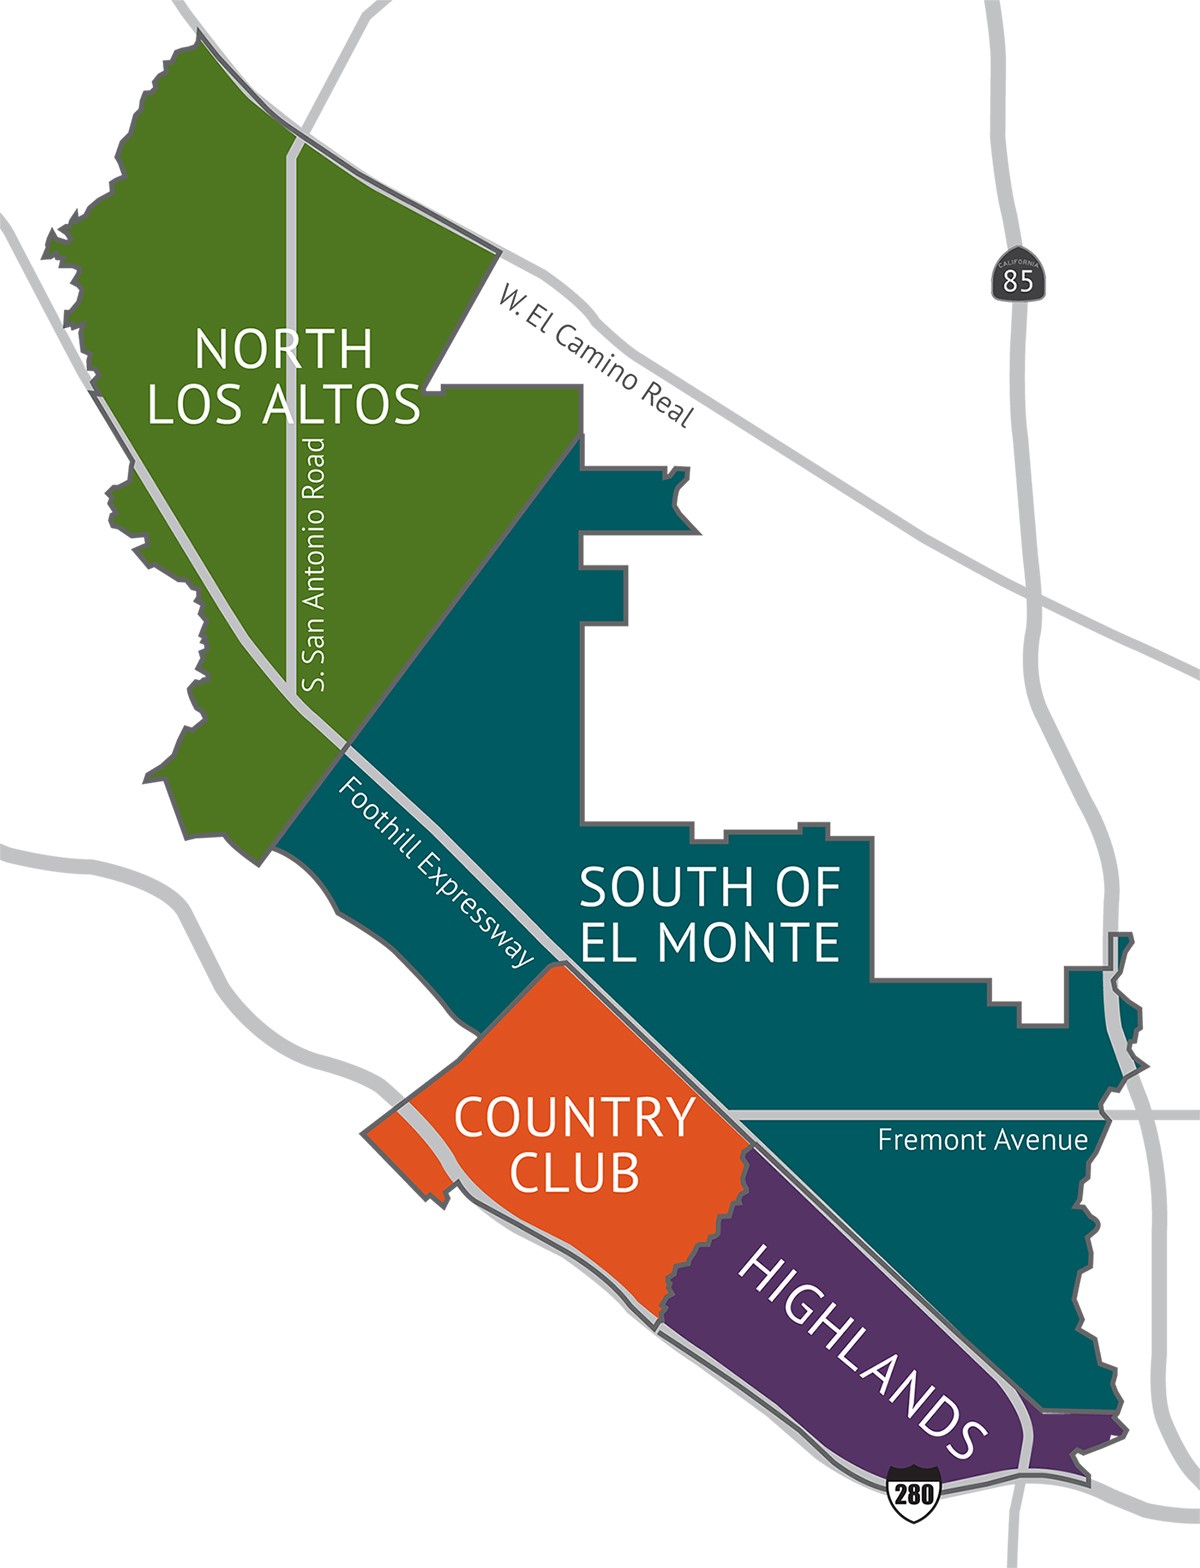
Rollover or click map to see more information for each area.
The average price in the 3rd quarter was $5,217,138, down from $5,529,983 in the 2nd quarter, and $6,321,206 in the 1st quarter. 14 homes, or 56%, sold for $5 million or more and only 1 home sold for less than $3 million. The average price year-to-date in North Los Altos, of $5,685,276, was 14% higher than it was in all of 2024.
There were 25 sales in the 3rd quarter, compared to 29 sales in the 2nd quarter, and 17 sales in the 1st quarter. 56% of the homes sold for more than list price. Only 5 homes took longer than 3 weeks to sell.
The average price per square foot in North Los Altos in the 3rd quarter was $2,300. This was 16% higher than it was in all of 2024.
There were 3 sales in the Country Club in the 3rd quarter, with a range of prices from $3,600,000 to $8,200,000. There were 10 sales in the 2nd quarter and 4 sales in the 1st quarter. The 3rd quarter average price was $5,263,333 and the median price was $3,990,000.
The average price year-to-date through the 3rd quarter was $4,738,632, representing a slight increase since 2024. 1 of the 3 homes, the most expensive one at $8,200,000, sold for 2.5% more than list price. On average, the homes sold for 99% of list price.
The average price per square foot in the Country Club in the 3rd quarter was $1,721. This was 4% higher than it was in all of 2024.
Sales were strong in the 3rd quarter with 11 sales between $3,605,000 and $5,375,000. There were 9 sales in the 2nd quarter and 7 sales in the 1st quarter. Year-to-date through the 3rd quarter, the average price of $4,069,413 was down 7% compared to all of 2024.
7 of the 11 homes sold in the 3rd quarter sold for more than list price. On average, homes sold for 107% of list price.
The price per square foot in the Highlands in the 3rd quarter was $1,771, which was 5% higher than all of 2024.
The average price in the 3rd quarter was $4,610,973, compared to $5,072,345 in the 2nd quarter and $5,944,989 in the 1st quarter. Year-to-date, the average price of $5,096,071 was 11% higher than it was in all of 2024.
There were 31 sales in the 3rd quarter; 5 sales were for more than $6 million and there was just 1 sale for less than $3 million. Of the 31 sales, 52% sold for more than list price. On average, homes sold for 104% of list price.
Average price per square foot in the 3rd quarter was $1,880, which was 3% lower than all of last year.